
Introduction
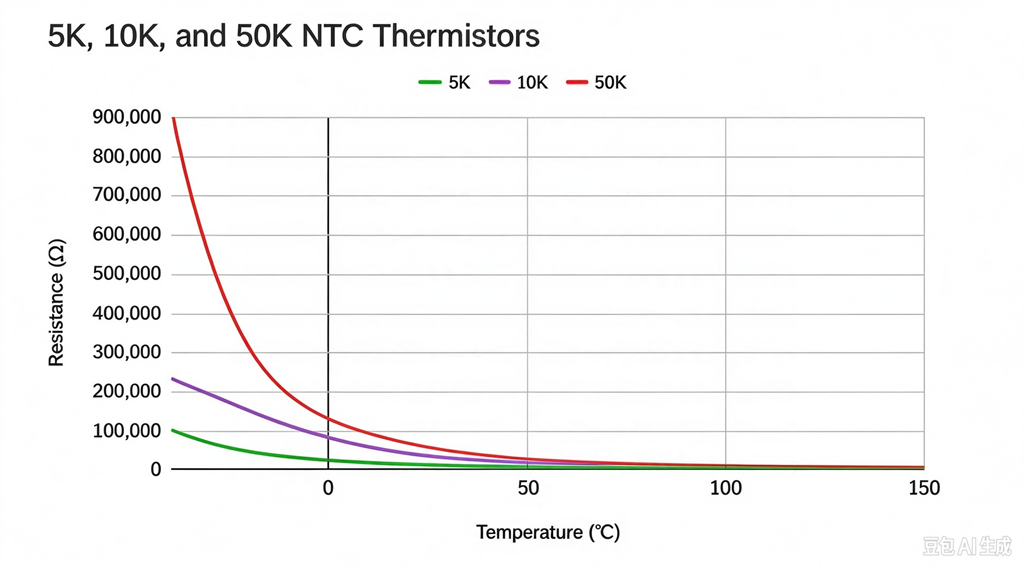
An NTC thermistor resistance-temperature table, commonly called an RT table or R/T table, shows how the electrical resistance of a thermistor changes with temperature.
This information is essential when designing temperature measurement circuits, programming a microcontroller, selecting a thermistor for an OEM product, or replacing an existing component.
Unlike a conventional resistor, an NTC thermistor does not maintain a nearly constant resistance as its temperature changes. Its resistance generally decreases as temperature increases. The relationship is nonlinear, so the resistance change per degree is not constant throughout the operating range.
An RT table provides the resistance values associated with specified temperatures, allowing engineers to translate a measured resistance into an estimated temperature.
However, not all RT tables describe the same product or the same tolerance limits. Engineers must check the nominal resistance, B value, reference temperature, operating range, and measurement conditions before using the data.
This guide explains how to read an NTC thermistor RT table, how resistance values are calculated or interpolated, and how to use RT data for component selection and replacement.
1. What Is an NTC Thermistor RT Table?
An RT table lists the relationship between resistance (R) and temperature (T) for a specified thermistor.
A simplified table might look like this:
| Temperature | Resistance |
| 0°C | Product-specific value |
| 25°C | Nominal R25 |
| 50°C | Product-specific value |
| 85°C | Product-specific value |
| 100°C | Product-specific value |
The actual resistance values depend on the thermistor’s nominal resistance, B value, material characteristics, and specified resistance-temperature curve.
An RT table may contain values at regular temperature intervals, such as every 1°C, 5°C, or 10°C. Some manufacturers provide a more extensive table covering the full operating range, while others provide selected resistance values and an equation.
For accurate engineering work, use the table corresponding to the exact product series and part number. A generic table for a 10 kΩ NTC thermistor should not be treated as the guaranteed characteristic of every 10 kΩ component.
2. Why Does NTC Resistance Change With Temperature?
NTC stands for Negative Temperature Coefficient.
As temperature increases, the resistance of an NTC thermistor generally decreases. This behavior results from the electrical properties of the semiconductor ceramic or other temperature-sensitive material used in the sensing element.
The resistance-temperature relationship is nonlinear. For this reason, a resistance change of 1 kΩ may represent a different temperature interval at different points on the curve.
For example, the resistance difference between 0°C and 5°C may be substantially different from the resistance difference between 80°C and 85°C.
This nonlinear behavior is one reason engineers use an RT table rather than a simple linear conversion formula.
3. How to Read an RT Table
When reading an NTC thermistor resistance-temperature table, follow these steps.
Step 1: Confirm the product specification
Check the manufacturer’s part number and confirm that the table applies to the selected thermistor.
Step 2: Identify the temperature column
Locate the required temperature, such as 0°C, 25°C, 50°C, or 100°C.
Step 3: Read the corresponding resistance
Find the resistance value associated with that temperature.
Step 4: Check the units
Resistance may be expressed in ohms, kilohms, or another stated unit. For example, 10 kΩ equals 10,000 Ω.
Step 5: Check whether the value is nominal or a limit
A nominal RT table generally describes the typical or specified nominal curve. It does not necessarily mean that every production part will measure exactly that resistance.
If the application requires guaranteed resistance limits, check the applicable tolerances or the manufacturer’s minimum and maximum resistance data.
4. How R25 and B Value Relate to the RT Table
R25 and B value are two important parameters used to describe an NTC thermistor.
R25 is the nominal resistance at 25°C.
The B value describes the resistance-temperature relationship over a specified temperature interval. It is commonly used to estimate resistance at another temperature.
A simplified beta equation is:
R(T) = R25 × exp[B × (1/T − 1/T25)]
Where:
- R(T) is the resistance at temperature T.
- R25 is the nominal resistance at 25°C.
- B is the beta value for the specified interval.
- T and T25 are absolute temperatures in kelvins.
- T25 is 298.15 K.
This equation can be useful for preliminary calculations. However, the calculated resistance is an approximation when a single B value is used to represent the curve over a broad range.
Actual NTC characteristics may require a more detailed model or manufacturer-provided RT data.
When accuracy matters, do not replace a manufacturer’s RT table with values calculated from a generic B value without validating the difference.
5. How to Calculate Resistance at a Different Temperature
Suppose a hypothetical NTC thermistor has:
- R25 = 10 kΩ
- B25/85 = 3950 K
To estimate the resistance at 50°C, convert the temperatures to kelvins:
T25 = 298.15 K
T50 = 323.15 K
Then apply the beta equation:
R50 = 10,000 × exp[3950 × (1/323.15 − 1/298.15)]
The result is approximately 3.59 kΩ.
This is an illustrative calculation, not a guaranteed value for a commercial thermistor.
The actual resistance at 50°C should be taken from the relevant manufacturer’s RT table or verified against the exact part specification.
The example illustrates why a thermistor’s resistance at 50°C cannot be determined from R25 alone. The B value is also required for the calculation.
6. What Is the Difference Between a Calculated RT Value and a Manufacturer’s RT Value?
A calculated RT value is obtained using a mathematical model. A manufacturer’s RT table represents the resistance-temperature characteristic specified or characterized for a particular product.
The two may differ because the simple beta equation approximates the nonlinear resistance-temperature relationship.
For a narrow temperature interval, the beta model may provide a useful estimate. Over a wider interval, the deviation may become more significant.
Manufacturers may provide experimentally characterized resistance-temperature data or use a more detailed mathematical representation, such as the Steinhart-Hart equation, when appropriate.
For design work, the correct choice depends on the required accuracy and the available product data.
Use calculations for preliminary evaluation, but use the relevant manufacturer specifications when setting acceptance limits or approving components for production.
7. How to Interpolate Between Two RT Table Values
Sometimes a controller measures a resistance that falls between two entries in an RT table.
One possible approach is linear interpolation between the two nearest resistance values.
Suppose a hypothetical table contains:
| Temperature | Resistance |
| 40°C | 5.30 kΩ |
| 45°C | 4.55 kΩ |
If the measured resistance is 4.90 kΩ, linear interpolation estimates the temperature as follows:
T ≈ 40 + [(5.30 − 4.90) / (5.30 − 4.55)] × 5
T ≈ 42.7°C
These values are illustrative. The calculated result is an estimate, not a guaranteed measurement accuracy.
Linear interpolation can be adequate over sufficiently small intervals when the required accuracy allows it. However, resistance is nonlinear with temperature, so interpolation errors depend on the interval and the actual curve.
For higher accuracy, use a denser RT table, a suitable curve-fitting method, or the manufacturer’s recommended conversion procedure.
8. How to Use an RT Table in a Microcontroller
Many temperature measurement systems use an NTC thermistor connected to a fixed resistor in a voltage-divider circuit.
The microcontroller measures the resulting voltage, calculates the thermistor resistance, and converts the resistance into temperature.
A common implementation uses a lookup table containing resistance values and corresponding temperatures.
The conversion process typically involves:
- Reading the analog-to-digital converter value.
- Converting the ADC value into voltage.
- Calculating the thermistor resistance using the known circuit configuration.
- Finding the closest RT table entries.
- Interpolating between entries when appropriate.
- Applying any required calibration or error correction.
The exact equations depend on whether the thermistor is connected to the supply or ground side of the divider.
Engineers should also account for the fixed resistor’s tolerance, ADC reference accuracy, measurement noise, leakage current, and thermistor self-heating where relevant.
A correct RT table cannot compensate for an incorrect circuit equation or an incorrectly configured measurement system.
9. How to Compare RT Tables When Replacing an NTC Thermistor
When replacing an existing thermistor, compare the original and proposed replacement over the entire required operating range.
Do not compare only the nominal R25 and B value.
A practical comparison should include:
- R25 and its tolerance.
- B value and its specified interval.
- Resistance at the minimum operating temperature.
- Resistance at critical control temperatures.
- Resistance at the maximum operating temperature.
- Minimum and maximum resistance limits where available.
- Package, lead configuration, and thermal response.
- Environmental and reliability requirements.
For example, a replacement may have the same R25 but a different resistance at 0°C or 100°C. If the controller uses a fixed RT table, this difference may produce an incorrect temperature reading.
A useful engineering method is to create a comparison spreadsheet containing the original and replacement resistance values at each critical temperature. Calculate the resistance difference and evaluate its effect on the expected measurement error.
If the original RT table is unavailable, request the datasheet or obtain controlled measurements from a known-good sample. Measurements at only one or two temperatures may not be sufficient to establish interchangeability.
10. Nominal Resistance, Tolerance Limits, and Production Testing
RT tables must be interpreted alongside the manufacturer’s tolerance specifications.
For example, a nominal resistance value at a particular temperature does not automatically define the full acceptable range of every manufactured component.
The applicable limits may depend on R25 tolerance, B-value tolerance, additional curve specifications, or a separately defined resistance tolerance at the target temperature.
If a customer requires a specific resistance range at 0°C, 50°C, or 100°C, the manufacturer should confirm whether that requirement is covered by the standard specification.
When necessary, manufacturers may evaluate additional test points or implement a defined screening process. The exact approach depends on the product design, production capability, and agreed acceptance criteria.
For OEM projects, it is useful to specify the critical temperature points and the required resistance limits directly in the technical drawing or purchasing specification.
11. Common Mistakes When Using an RT Table
Mistake 1: Using the wrong product’s table
Two thermistors with the same R25 may have different B values and resistance-temperature curves.
Mistake 2: Confusing nominal values with guaranteed limits
A nominal curve is not automatically a minimum-and-maximum production specification.
Mistake 3: Mixing Celsius and kelvins in the beta equation
The beta equation uses absolute temperature in kelvins.
Mistake 4: Assuming linear resistance change
NTC resistance is nonlinear with temperature. Linear interpolation should be applied carefully.
Mistake 5: Ignoring self-heating and installation effects
The temperature of the sensing element may differ from the temperature of the surrounding medium.
Mistake 6: Approving a replacement using only R25
A suitable replacement must also match the required RT characteristics, mechanical structure, and application conditions.
Conclusion
An NTC thermistor resistance-temperature table provides the relationship between resistance and temperature for a specified component. It is essential for temperature measurement, circuit programming, component comparison, and replacement evaluation.
R25 and B value are useful for understanding the curve, but they do not always provide enough information for high-accuracy applications. A manufacturer-specific RT table and clearly defined tolerance limits are more useful when evaluating performance across the complete operating range.
For OEM engineers and purchasing teams, the best practice is to use the correct product data, verify the conversion method, and validate the selected thermistor in the final application.
Need an NTC thermistor with a specific resistance-temperature characteristic?
Temprix supplies NTC thermistors and temperature sensor solutions for OEM and industrial applications. Share your required R25, B value, operating temperature range, critical resistance limits, or existing RT table with our team.